

Appearances are often deceiving — Aesop Fable
Who makes the investment decision?
This is a question investment managers are regularly asked by advisers and investors. With more investors embracing passive investing over active management, now more than ever, this question has become important.
For active investment, the fund manager makes investment decisions based on the fund’s documented investment strategy. For passive investments, this strategy often entails tracking an identifiable index, one generally created by a third-party provider. As a result, the decisions of each index provider ultimately have a substantial impact on the fund’s investment return: how an index is created, what stocks or countries are included/excluded, and how indices evolve, can all have a dramatic impact on performance.
So when it comes to index investing, perhaps an equally important question to ask is – how are investment decisions made?

When investing in passive products, it is imperative that investors understand the index construction process so that they know exactly what they are investing in. Not all indices are created in the same manner.
One example of how index provider decisions can impact portfolio performance can be seen in the recent IPO of SpaceX. This stock began trading on 12th June 2026, with a valuation of approximately $1.7 trillion, making it one of the biggest companies in the world by market capitalisation at that time.
Following standard inclusion procedures, SpaceX will not be eligible for inclusion into the S&P 500 Index until at least mid-2027. Under S&P 500 rules, a company must be publicly traded for at least a year before consideration for inclusion. Even after this initial waiting period, SpaceX may still not meet some of the other requirements – for example, profitability metrics.
The Nasdaq-100 index also had similar eligibility rules, which may have prevented the inclusion of SpaceX. However, on the 1st of May 2026, Nasdaq changed its index inclusion rules, reducing the period of trading required for membership. SpaceX subsequently joined the Nasdaq 100 Index on the 7th of July, 15 trading days after its IPO.
An inclusion in an index that has a large amount of passive investment tracking it is likely to bring a flurry of demand for Space X, as passive funds and ETFs buy the stock to keep tracking error against the index low.
This change in eligibility criteria for the Nasdaq index may also lead to the eventual inclusion of future high-profile IPOs, such as Anthropic and OpenAI, whose IPOs are expected in the next 12 months. The decision to change these criteria for Nasdaq, compared to the S&P 500, which retained the 12-month trading period for inclusion, materially impacted the investment allocation for passive investors who track this index. Whilst one approach is not necessarily superior to the other, it does highlight the importance of understanding how these decisions could impact investment exposure.

Similarly, index construction methodology can also play an important role in how passive investments behave. The most common form of index construction methodology is market-cap weighted, where the size of each constituent’s allocation in an index is based on the market capitalisation of that company. Most indices, such as the S&P 500 and FTSE 100, use this methodology. On the other hand, some indices — such as the Nikkei 225 in Japan — use an alternative approach: price-weighting. This calculates the allocation of a stock in the index based on the price of one share of that company, rather than its market value.
Using these two examples, the difference in methodology can create substantial variations in allocation. Comparing the Nikkei 225 Index with the broader based, market-cap weighted Topix Index can help highlight this. On a price-weighted basis, the three largest positions in the Nikkei 225 each have approximately 10% exposure (as of July 2026):
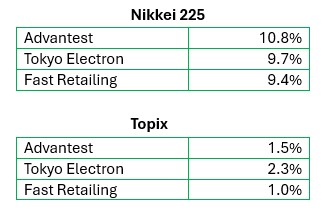
Granted, there are other index construction elements involved that should be considered, but it is evident how the methodology chosen can determine different levels of allocation. Whilst these three stocks account for almost 30% of the Nikkei 225 Index, they make up only around 5% of the Topix Index. Consequently, this is likely to create greater concentration risk for the Nikkei 225 Index, where the performance of one of these three stocks could skew the overall performance. This is particularly important for investors to understand so that they can determine which “type” of Japanese equity exposure they are looking for, especially when hedging – where hedges on the Nikkei 225 may be less effective if performance is concentrated.
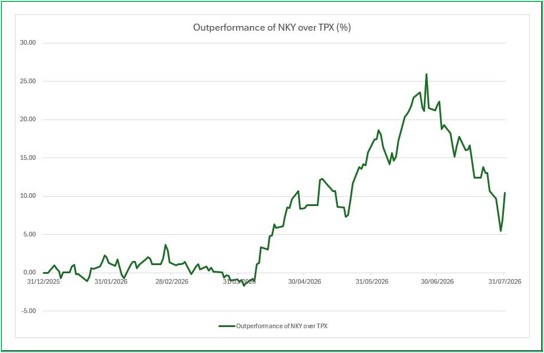
The potential for differences in returns between these two indices are evident by Chart A, which shows the outperformance of the Nikkei 225 Index (NKY Index) compared to the Topix Index (TPX Index) year to date.
For the first quarter, the performance of the two indices was similar. However, in the second quarter, the NKY Index substantially outperformed the TPX Index. The TPX Index recovered strongly in July against NKY Index. At its peak, the Nikkei 225 was outperforming the Topix Index by almost 26% YTD. Once again, neither methodology is necessarily better or more representative of the Japanese market than the other, but it does highlight the importance, and possible outcome, of which index you track.
A similar pattern can be seen with emerging markets. There are two main ‘Emerging Market’ indices that passive investors usually track, and the differences in their methodology are noticeable, especially with regard to the topic of South Korea. The FTSE Emerging Market Index does not include South Korea, as it is classed as a developed market in the FTSE methodology. In contrast, the MSCI Emerging Markets Index does include South Korea, which MSCI classes as an emerging market due to concerns over the accessibility of the Korean Won.
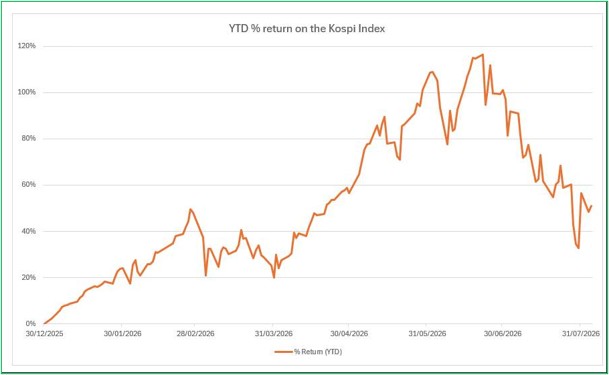
Generally, this difference may make some, but not very noticeable, difference over a long investment period. However, for the last 12 months this performance differential has been significant . The South Korean stock market has been on a massive rally, dominated by two stocks – Samsung and SK Hynix (both semiconductor stocks part of AI global rally). This has led to the South Korean stock index (as measured by the KOSPI Index) rallying 100% in the first six months of 2026 (as shown in Chart B).
This impressive performance has had a significant impact on Emerging Market Indices, in terms of their comparative returns. The MSCI Emerging Market Index, which includes South Korea, is up 22% in the first half of 2026, whilst the FTSE Emerging Market Index, which does not include South Korea, is up 8% over the same period. Chart C shows the performance differential between the two indices year to date. As with the Japan indices, there has been a substantial retracement of that performance differential in July 2026.
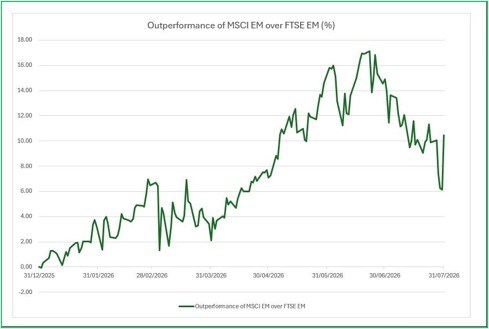
The decision by FTSE to classify South Korea as a developed market many years ago, coupled with the decision by MSCI to retain South Korea as an ‘Emerging Market’, has contributed to a substantial difference for passive investors in this space over the last year, both in terms of performance and volatility.
As passive investing becomes more prevalent, it’s important to understand the crucial decisions that index providers make – whether it’s inclusion rules, rebalancing, country classification, etc. – and how these decisions may impact investment outcomes. There is no right or wrong way to create an index, but it is imperative that investors understand what allocations, exposure and risk a passive investment gives them. Not all indices are the same and investors should be aware of that. All of these important details are available to you and they should be considered.
So when it comes to investing, it’s important to keep asking – how are investment decisions made?
Disclaimer: FOR PROFESSIONAL USE ONLY. This report was produced by Collidr Research (“Collidr”). The information contained in this report is for informational purposes only and should not be construed as a solicitation or offer, or recommendation to acquire or dispose of any investment. While Collidr uses reasonable efforts to obtain information from sources which it believes to be reliable, Collidr makes no representation that the information or opinions contained in this report are accurate, reliable or complete. The information and opinions contained in this report are provided by Collidr for professional clients only and are subject to change without notice. You must in any event conduct your own due diligence and investigations rather than relying on any of the information in the report. All figures shown are bid to bid, with income reinvested. As model returns are calculated using the oldest possible share class, based on a monthly rebalancing frequency and all income being reinvested, real portfolio performance may vary from model performance. Portfolio performance histories incorporate longest share class histories but are either removed or substituted to ensure the integrity of the performance profile is met. The value of investments and the income from them can go down as well as up and past performance is not a guide to the future performance.
Collidr Research is a trading name of Collidr Technologies Ltd, registered in England and Wales No. 09061794. Registered office: Adler House, 35 36 Eagle Street, London, WC1R 4AQ.